Model overview: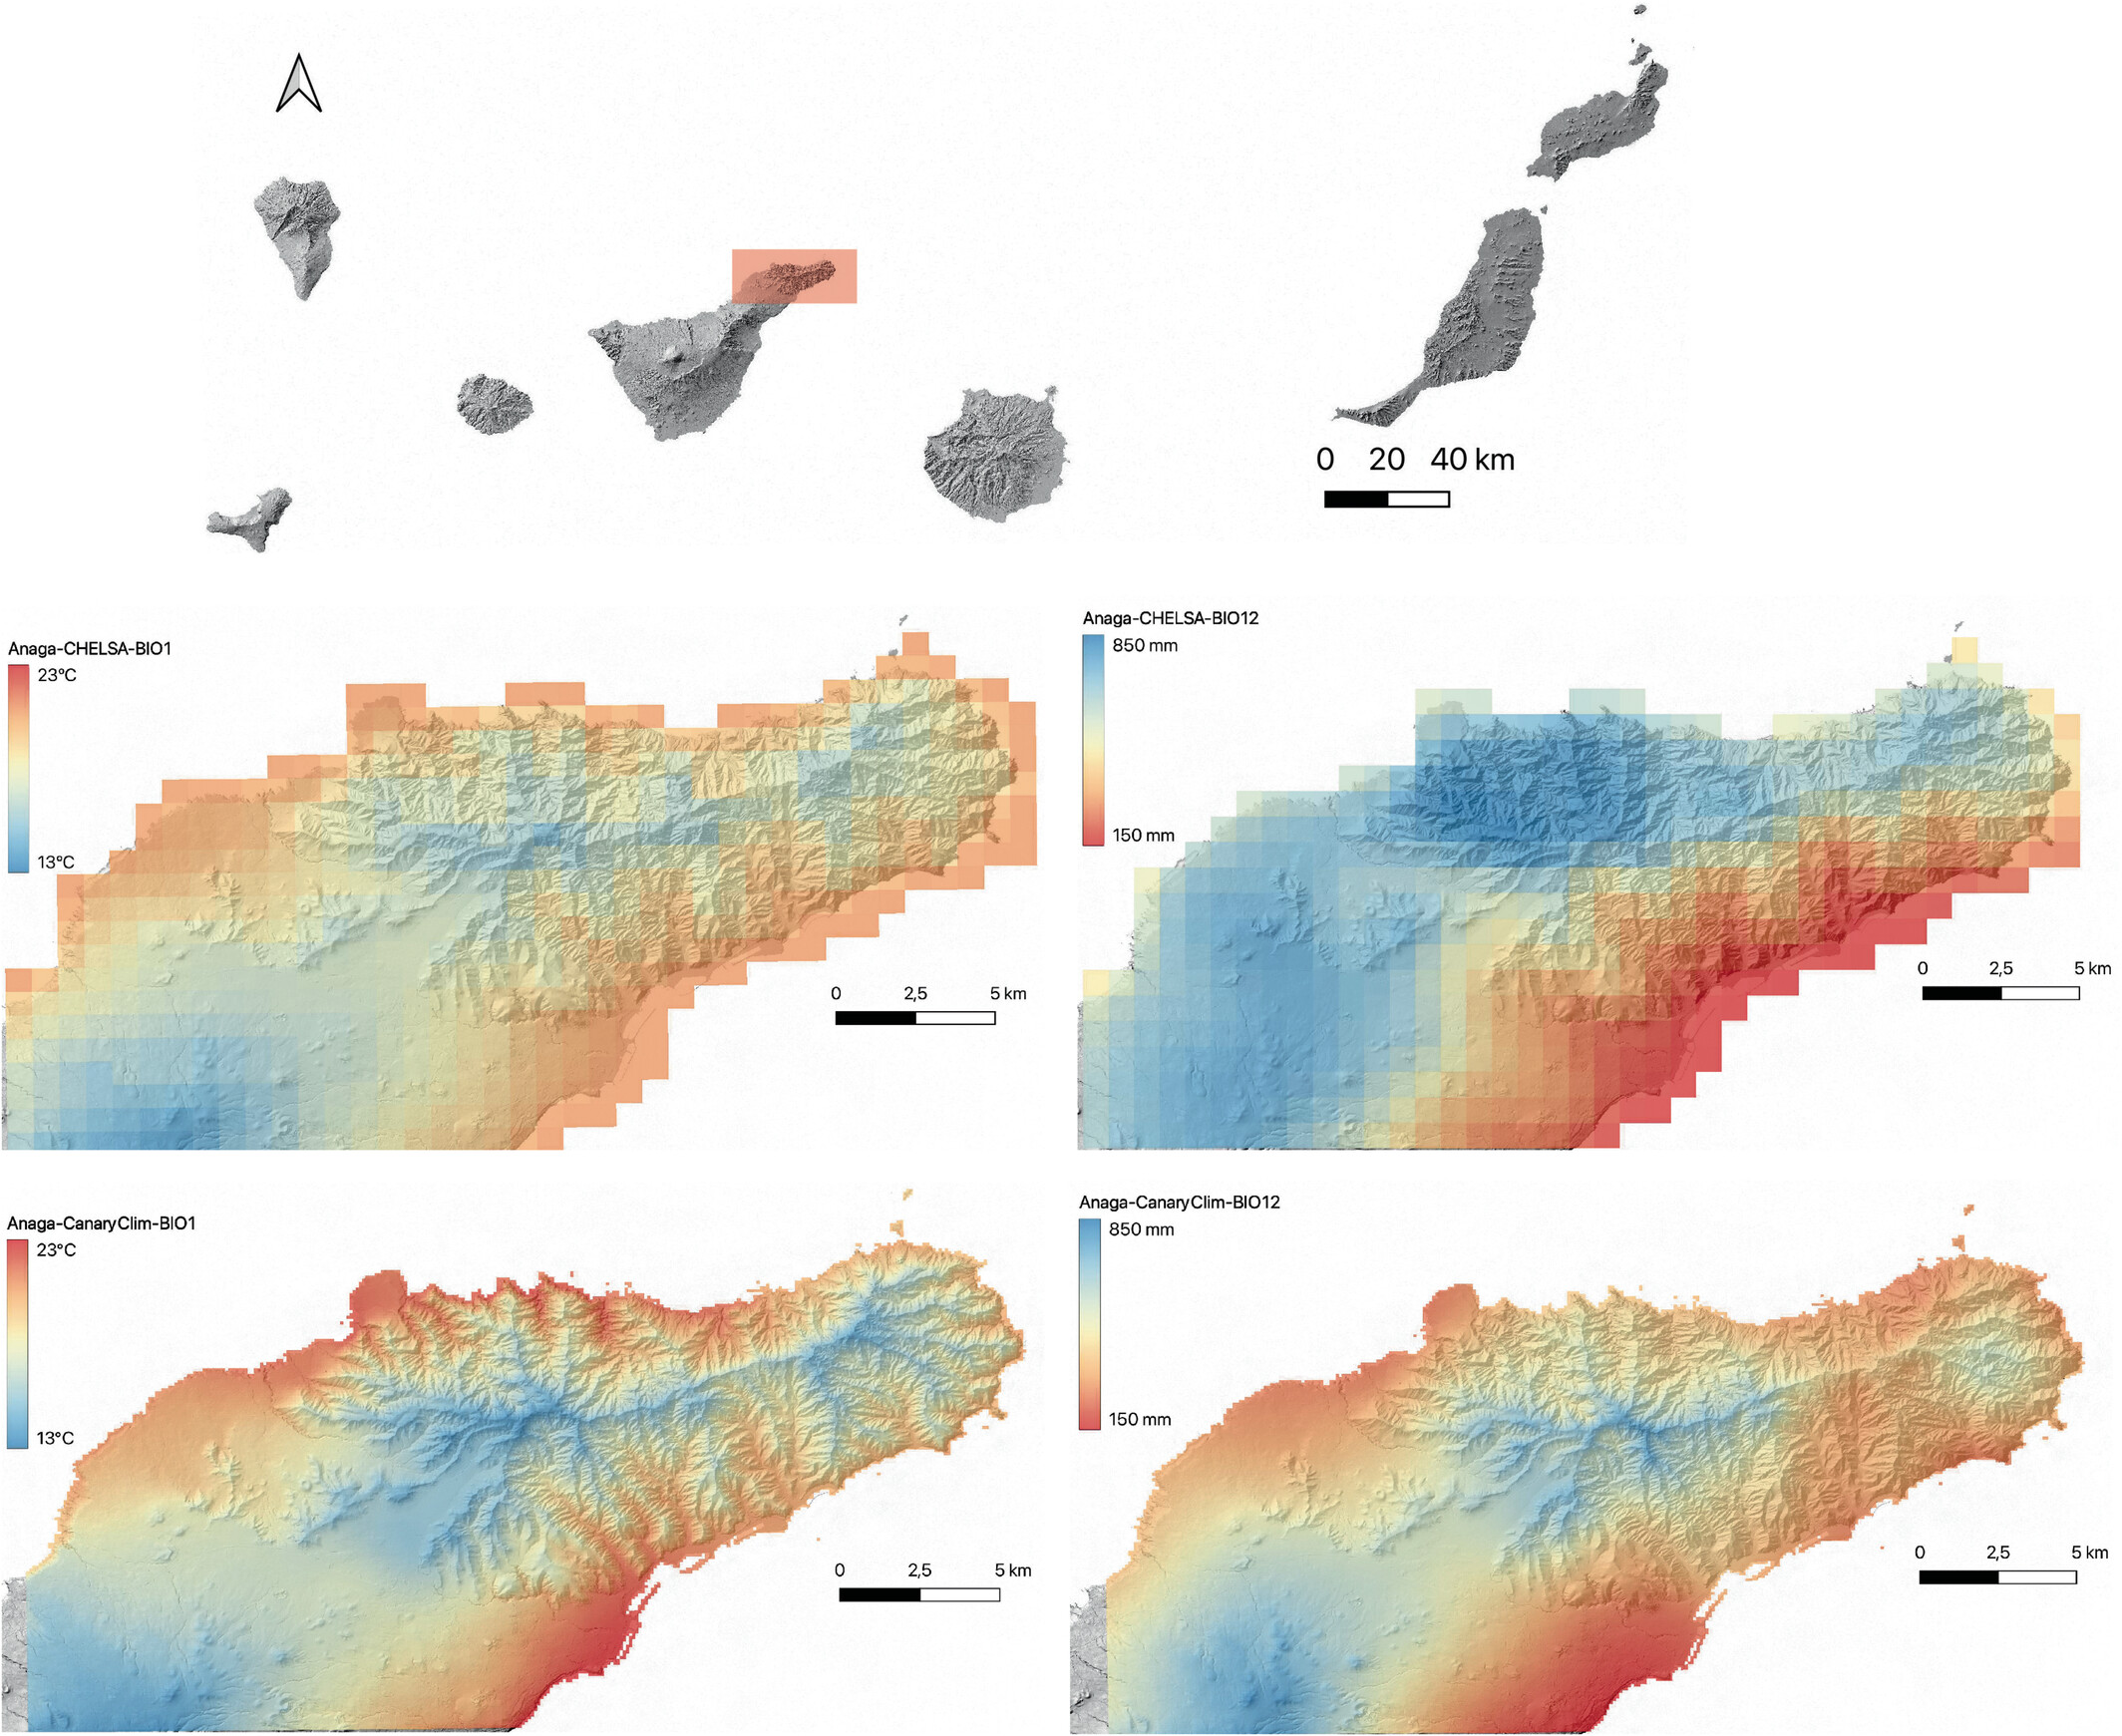
Figure 1 | Comparison of mean annual air temperature (BIO1; left panels) and annual precipitation amount (BIO12; right panels) from 1979 to 2013 predicted from two climatic datasets with different resolutions (~1 km in CHELSA and 100 m in CHELSA-CanaryClim) from (https://doi.org/10.1111/ddi.13757). Values are provided for the Anaga Peninsula (Tenerife, Canary Islands) as an example.
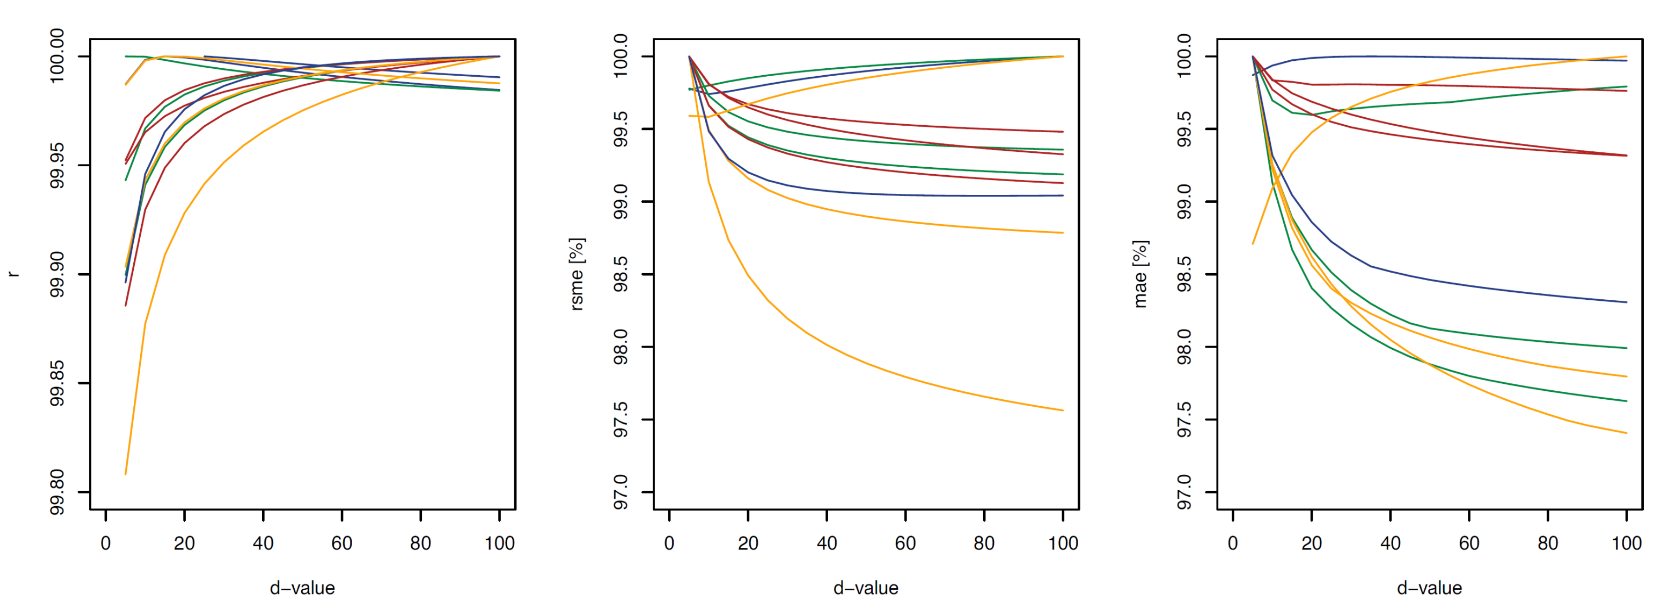
Figure 2 | Sensitivity analysis of the parameters used in the precipitation downscaling algorithm, that scales the terrain effect towards the boundary layer height (PBL) from (https://doi.org/10.1111/ddi.13757). Blue lines = winter, green lines = spring, red lines = summer, orange lines = autumn. All performance variables (r, rmse, mae) are shown as percentage towards the maximum.
Input Data:
CHELSA-CanaryClim v1.0 downscales climate fields from CHELSA V1.2 and integrates observational data from meteorological stations across the Canary Islands to refine precipitation and temperature estimates. The input data include monthly near-surface air temperature variables (tasmax, tasmin), monthly precipitation rates (pr), and high-resolution elevation data from GMTED2010. Additional atmospheric input variables such as geopotential height and lapse rates are derived from ERA-Interim reanalysis data, based on vertical temperature profiles between 1000 and 300 hPa. Planetary boundary layer (PBL) height from ERA-Interim is used to quantify the distance between surface elevation and boundary layer height, which informs a boundary layer correction for precipitation. The orography data, including high-resolution terrain at 5?m and 1?km resolution, form the physical foundation for all downscaling procedures.
Downscaling Methodology:
CHELSA-CanaryClim is based on the downscaling of CHELSA V1.2 and incorporates observational data from 207 meteorological stations for precipitation and 101 stations for maximum and minimum air temperatures. Observations span from approximately 1972–2017, with analysis restricted to the 1979–2013 period to match CHELSA V1.2. Additional input includes lapse rates and planetary boundary layer (PBL) height from ERA-Interim reanalysis, and elevation data from GMTED2010.
Bias correction:
Precipitation: Bias correction is based on the ratio of observed to modeled monthly precipitation, with a small constant added to avoid division by zero. The resulting bias ratios are interpolated using a multilevel B-spline method with 14 refinement levels to generate a seamless 1?km bias correction surface, which is then applied to the CHELSA V1.2 precipitation estimates. emperature (tasmax, tasmin): similar bias correction procedure as precipitation is used. Observed temperatures are adjusted for elevation mismatch using the lapse rate and station elevation difference. The resulting bias is interpolated using multilevel B-spline interpolation to 1?km resolution and applied to the downscaled temperature data, which is then further downscaled to 5?m resolution.
Validation summary:
The performance of CHELSA-CanaryClim v1.0 under present-day conditions (1979–2013) was evaluated using a 10-fold cross-validation repeated over 10 iterations. In each iteration, one-tenth of the meteorological station data was withheld and used as a test set, while the remaining data served to recalibrate the bias correction for both temperature and precipitation. The resulting climatological surfaces were assessed using several statistical metrics, including Pearson’s correlation coefficient (r), root mean squared error (RMSE), mean absolute error (MAE), and the Kling–Gupta efficiency (KGE). The reported mean correlations between downscaled and observed values were 0.74?±?0.22 for maximum monthly temperature, 0.85?±?0.05 for minimum monthly temperature, and 0.82?±?0.07 for monthly precipitation. Corresponding mean absolute errors were 1.23?K for maximum temperature, 1.10?K for minimum temperature, and 8.91?kg?m?²?month?¹ for precipitation, based on averages across all months. These error metrics reflect the model’s overall ability to capture monthly climatic variation with a high degree of accuracy. Compared to the original CHELSA V1.2 outputs, CanaryClim showed significant improvements in topographically complex areas of the Canary Islands, particularly along montane ridges and north-facing slopes such as those in the Anaga Peninsula of Tenerife. The validation results demonstrate that the high-resolution downscaling and bias correction approaches used in CanaryClim effectively reduce systematic biases and improve spatial detail in modeled climate variables under current conditions.
Variable specific downscaling algorithm:
| variable | Downscaling |
| pr | Downscaling includes a boundary layer correction method that accounts for mesoscale orographic effects. Using PBL height from ERA-Interim, the vertical distance (?z) between surface topography and the boundary layer is calculated, and a logarithmic scaling function is applied to adjust precipitation based on terrain elevation. This helps correct for the reduced cloud presence at high elevations and the limited precipitation influence below the boundary layer in regions like the Canary Islands. |
| tas, tasmax, tasmin | Temperature downscaling follows a lapse-rate approach using ERA-Interim geopotential height and temperature data at pressure levels from 1000–300 hPa. Monthly lapse rates are calculated via linear regression and interpolated to a 5 m resolution. Station temperatures are adjusted for elevation differences between station and grid elevations before applying the lapse rate correction and B-spline interpolation for high-resolution output. |